View the latest status of the ozone layer over the Antarctic, with a focus on the ozone hole. Satellite instruments monitor the ozone layer, and we use their data to create the images that depict the amount of ozone.
Click any map image to bring up a new page with a high-resolution image.
Ozone Movies
Watch a movie of the daily progression through a season or the annual progression of the means for a month. A table of all ozone movies are available in our multimedia section.
| 360x240 | 720x486 | 1280x720 | 1920x1080 | |||
| 2025 | mp4 | mpg | mp4 | mpg | mp4 | mp4 |
| 2024 | mp4 | mpg | mp4 | mpg | mp4 | mp4 |
| November | mp4 | mpg | mp4 | mpg | mp4 | mp4 |
Data sources
- NASA TOMS
- Aura OMI (KNMI | NASA) OMTO3d (Global Ozone Data)
- Suomi NPP OMPS NMTO3-L3-DAILY
- NASA GMAO
- ESA GOME
-
SBUV/2
- NASA Nimbus-4, Nimbus-7
- NOAA-9, NOAA-11, NOAA-14, NOAA-16
- NASA JPL MLS
- NOAA South Pole Balloon Sondes
Ozone facts
What is ozone?
Ozone is a colorless gas. Chemically, ozone is very active; it reacts readily with a great many other substances. Near the Earth’s surface, those reactions cause rubber to crack, hurt plant life, and damage people’s lung tissues. But ozone also absorbs harmful components of sunlight, known as “ultraviolet B”, or “UV-B”. High above the surface, above even the weather systems, a tenuous layer of ozone gas absorbs UV-B, protecting living things below.
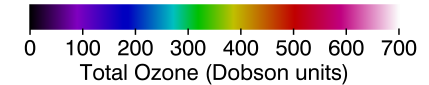
What is a Dobson Unit?
The Dobson Unit (DU) is the unit of measure for total ozone. If you were to take all the ozone in a column of air stretching from the surface of the earth to space, and bring all that ozone to standard temperature (0 °Celsius) and pressure (1013.25 millibars, or one atmosphere, or “atm”), the column would be about 0.3 centimeters thick. Thus, the total ozone would be 0.3 atm-cm. To make the units easier to work with, the “Dobson Unit” is defined to be 0.001 atm-cm. Our 0.3 atm-cm would be 300 DU.
What is the ozone hole?
Each year for the past few decades during the Southern Hemisphere spring, chemical reactions involving chlorine and bromine cause ozone in the southern polar region to be destroyed rapidly and severely. This depleted region is known as the “ozone hole”. The area of the ozone hole is determined from a map of total column ozone. It is calculated from the area on the Earth that is enclosed by a line with a constant value of 220 Dobson Units. The value of 220 Dobson Units is chosen since total ozone values of less than 220 Dobson Units were not found in the historic observations over Antarctica prior to 1979. Also, from direct measurements over Antarctica, a column ozone level of less than 220 Dobson Units is a result of the ozone loss from chlorine and bromine compounds.
27 November 2025

2025 Season
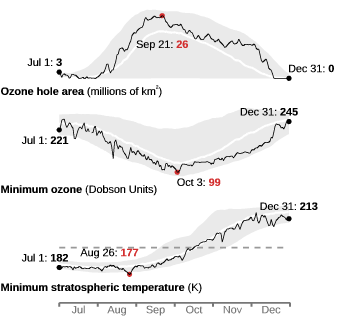
The graphs above show the progress of the ozone hole for 2025. The gray shading indicates the highest and lowest values measured since 1979. The red numbers are the maximum or minimum values. The stratospheric temperature and the amount of sunlight reaching the south polar region control the depth and size of the Antarctic ozone hole. The dashed line in the minimum temperature plot indicates the temperature below which Type I (NAT) PSCs can form.
The data for the ozone hole area, the minimum ozone, and the minimum stratospheric temperature are available. Also available is a table of values showing the maximum ozone hole area and the minimum ozone values for each year.
Annual records
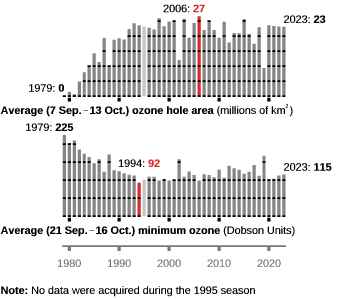
Click on the image to get a table of values.
The graphs above show the variations of ozone from year to year. The red bars indicate the largest area and the lowest minimum value. The year-to-year fluctuations are superimposed on a trend extending over the last three decades.