About the meteorological plots
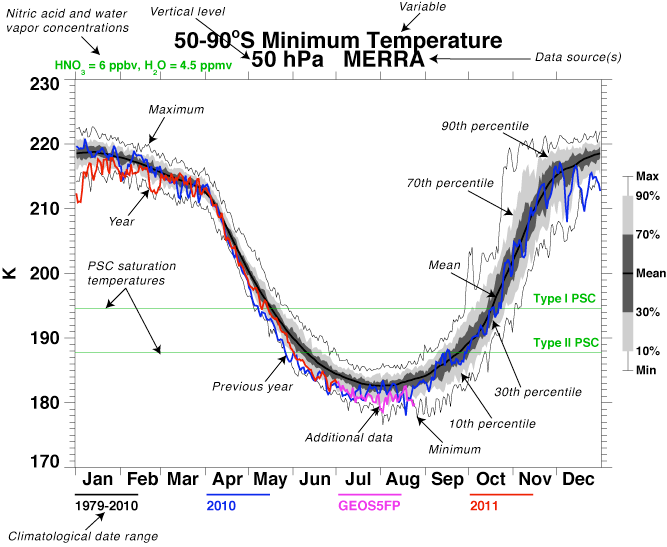
The figure below shows an example of the PDF plots. The variable of interest is shown in the title, along with the vertical level (if any) and the data source. The red line is the data for the current year and the blue line (if present) is the data for the previous year. The lines and shading follow a progression from bottom to top as the minimum (thin black line), the 10th percentile (light gray shading), 30th percentile (dark gray shading), mean (thick black line), 70th percentile (dark gray shading), 90th percentile (light gray shading), and the maximum (thin black line) over the climatological period. This climatological period always excludes the particular year for which the plot is shown. Each day has its own specific climatological values. A record value is indicated when the red or blue line is located outside one of the thin black lines. Note that the thick black line is the mean of the data, not the median (or the 50th percentile). You will often see the mean outside of the dark shaded area since many of the quantities plotted have a skewed distribution.