- What is Ozone?
- What is a Dobson Unit?
- What are Ozone Mini-Holes?
- What is the Polar Vortex?
- What is a Stratospheric Warming?
Topics
What are Ozone Mini-Holes?
The term “mini-hole” is derived from a comparison to the Antarctic ozone hole. However, a mini-hole is quite a bit different from the ozone hole in fundamental ways. First, mini-holes are much smaller in area coverage than the Antarctic ozone hole (as the name suggests). Second, while the Antarctic ozone hole is caused by high concentrations of chlorine and bromine derived from man-made chemicals, a mini-hole is a natural phenomena that is caused by particular weather patterns. Third, ozone is irreversibly depleted by man-made chemicals in the Antarctic ozone hole. In a mini-hole, ozone is rearranged by the weather systems and the ozone returns to its initial levels after the these weather systems pass.
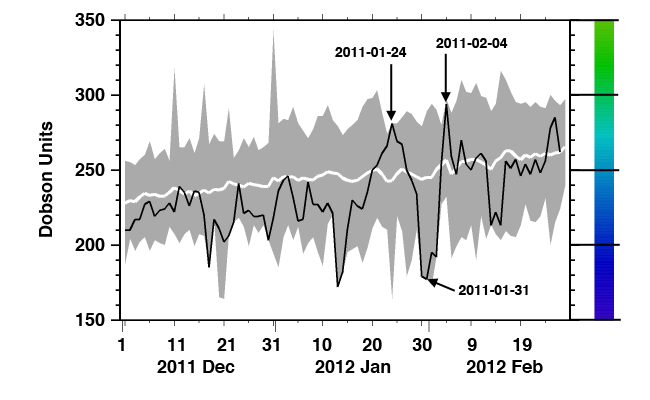
Northern hemisphere total ozone minima for December 2011 through February 2012 (black line), range of ozone minima for all years starting December 1978 (gray shading), and the average of all years (white line). The color scale on the right corresponds to the colors in the ozone images below.
The above figure shows the signature of ozone during a mini-hole event. The black line indicates the daily values of the lowest total ozone observations in the northern polar region during December 2011 through February 2012. On 24 January, the ozone level is very high, but 7 days later (31 January) it has plunged from 270 DU to about 180 DU. By 4 February, the ozone level has sprung back to a high level, about 290 DU. The shaded area indicates the highest and lowest minimums over the years beginning in December 1978. This event had one of the largest changes in minimum ozone of all years, extending from the top of the shading to the bottom of the shading and back.
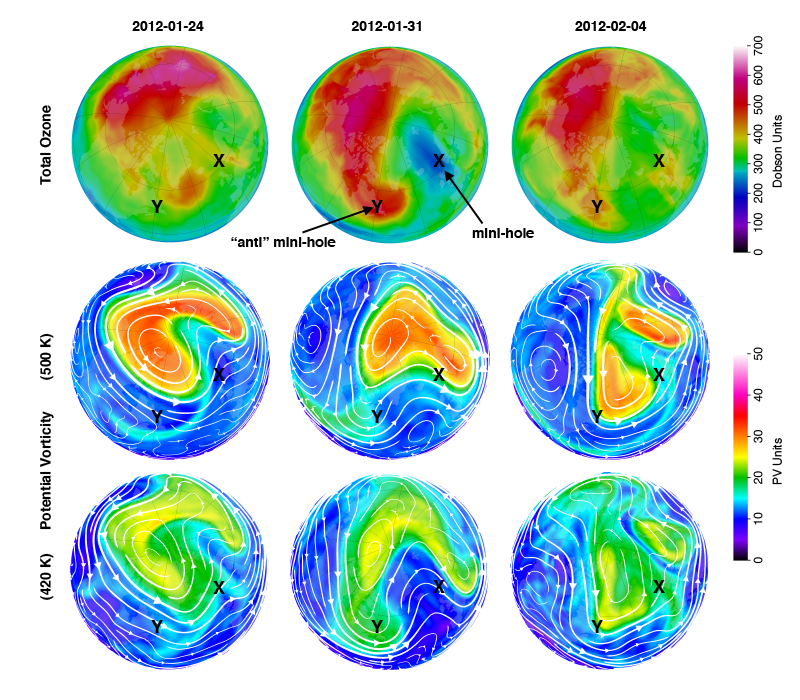
Northern hemisphere images for 24 January, 31 January, and 4 February of 2012. Top row: total column ozone; middle row: potential vorticity on the 500 K potential temperature surface; bottom row: potential vorticity on the 420 K potential temperature surface. The mini-hole is the prominent dark blue area in the top middle image, indicated with a black “X”. A corresponding area of high ozone values is inidcated with a “Y”.
The maps above are of total column ozone and potential vorticity (PV) for the three dates indicated in the previous figure. The top row contains images of total column ozone. The mini-hole can be seen in the top center image for 31 January as the blue blob and is indicated with a black “X” (also shown on all of the other images for reference). The top left and right images contain almost no blue in the polar regions, indicating moderate to high amounts of total ozone.
The middle row shows PV and streamlines on the 500 K isentropic surface (about 22.5 km altitude), while the bottom row shows PV on the 420 K isentropic surface (about 18 km altitude). In the bottom center panel (31 January) there is a very large area of low PV (midlatitude) air pushing towards the polar region (the large area of dark blue penetrating to the pole). The flow around this low PV is in a clockwise direction. This push of low PV air northward creates what is known as an anticyclonic flow, and low PV air generally coincides with the ozone mini-hole. The middle center panel shows that the location of the mini-hole is near the edge of the polar vortex. Column ozone is low for two reasons. First, midlatitude air at 420 K has low values of ozone. Second, the low PV values (blue color) at 420 K push below the higher value PV at 500 K (green and orange) and creates a lifting circulation. This lifting motion decreases ozone density in the lower stratosphere. The combined effects of a push northward of low ozone values with a density decrease by the lifting motion acts to dramatically decrease the total column ozone. This movement of weather systems at 420 K (18 km) and 500 K (22.5 km) creates the mini-hole.
An “anti” mini-hole of total ozone (high ozone) can be found to the west of the mini-hole on 31 January, indicated by the black “Y”. In this situation, high PV values at 420 K push down from the polar region and under-ride low PV values at 500 K. This creates a sinking motion that increases total column ozone, exactly the opposite motion from what creates the mini-hole. In the rightmost images, the weather systems are drifting off and dissipating, so the ozone levels return back to their normal state.