2006 Antarctic OMI and MERRA Ozone
Daily progression and annual means
The daily progression through the 2006 ozone hole season of the various ozone statistics, comparing 2006 to the climatology of all other years. Also, annual plots of statistics for monthly means. Clicking a link will bring up, in a new window, a PDF vector plot or a plain-text ASCII data file that is suitable for input into any program. The annual plots show the range of daily values that go into each year's average with gray shading.
ozone hole area
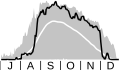
The ozone hole area is determined from total ozone satellite measurements. It is defined to be that region of ozone values below 220 Dobson Units (DU) located south of 40°S. Values below 220 DU represent anthropogenic ozone losses over Antarctica. The annual data are for 7 September–13 October, 1979–2016. On the annual plot, the area of North America is also shown for reference.
ozone minimum

The minimum ozone is found from total ozone satellite measurements south of 40°S. No interpolation of missing values is performed. This means that the actual minimum value on a day may be estimated too high, especially in the polar night region.
ozone mass deficit
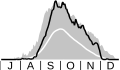
The ozone mass deficit is determined from total ozone satellite measurements. It combines the effects of changes in area and depth. It is the total amount of mass that is deficit relative to the amount of mass present for a value of 220 Dobson Units (DU). The annual data are for 21 September–13 October.
polar cap ozone

The total column ozone averaged around the polar cap for latitudes south of 63°S. Care should be used when evaluating these calculations for late April through late August, as a good portion of the area is in polar night. The missing observations are filled from a model.
year
- 1979
- 1980
- 1981
- 1982
- 1983
- 1984
- 1985
- 1986
- 1987
- 1988
- 1989
- 1990
- 1991
- 1992
- 1993
- 1994
- 1995
- 1996
- 1997
- 1998
- 1999
- 2000
- 2001
- 2002
- 2003
- 2004
- 2005
- 2006
- 2007
- 2008
- 2009
- 2010
- 2011
- 2012
- 2013
- 2014
- 2015
- 2016
- 2017
- 2018
- 2019
- 2020
- 2021
- 2022
- 2023
- 2024
- 2025
- 2026
variable
ozone mean latitude bands
The annual- and monthly-mean ozone for eight latitude bands: 90°S–90°N (global), 90–60°S, 60–30°S, 30–10°S, 10°S–10°N, 10–30°N, 30–60°N, 60–90°N. No interpolation of missing values is performed. Since the instruments only measure in sunlight, the actual global values for all months, 90–60°S values during April through September, and the 60–90°N values during October through March may be biased towards the lower latitudes.
Data description
The depth and area of the ozone hole are primarily governed by the amounts of chlorine and bromine in the Antarctic stratosphere. Very low temperatures are needed to form polar stratospheric clouds (PSCs). Chlorine gases react on the surface of these PSCs to release chlorine into a form that can easily destroy ozone. The chlorine and bromine chemical catalytic reactions that destroy ozone need sunlight. Hence, the ozone hole begins to grow as the sun is rising over Antarctica at the end of the winter.
The ozone hole begins to grow in August and reaches its largest area in depth from the middle of September to early October. In the early years (before 1984) the hole was small because chlorine and bromine levels over Antarctica were low. Year-to-year variations in area and depth are caused by year-to-year variations in temperature. Colder conditions result in a larger area and lower ozone values in the center of the hole.
Data sources
The data for 1979–1992 are from the TOMS instrument on the NASA/NOAA Nimbus-7 satellite.
The data for 1993–1994 are from the TOMS instrument on the Soviet-built Meteor-3 satellite.
The data for 1996–October 2004 are from the NASA Earth Probe TOMS satellite.
The data starting from November 2004 through June 2016 are from the OMI instrument (KNMI / NASA) onboard the Aura satellite. They are the OMTO3d that have been processed in a manner similar to the TOMS data from earlier years.
The data starting July 2016 are from the OMPS instrument onboard the Suomi NPP satellite.
The ozone minimum is determined only from data actually contained in the processed satellite data. To calculate the ozone hole area, mass deficit, and polar cap ozone missing areas (bad orbits and polar night) are filled using assimilated ozone data (MERRA for 1979 through June 2016, MERRA-2 for July 2016 through August 2017, and GEOS FP from September 2017 on) produced by the Goddard Earth Observing System Data Assimilation System (GEOS DAS). MERRA and MERRA-2 use a version of the GEOS model with the Gridpoint Statistical Interpolation (GSI) atmospheric analysis developed jointly with NOAA/NCEP/EMC. The GEOS FP system integrates forefront versions of the GEOS atmospheric general circulation model with advanced data assimilation techniques, using a broad range of satellite observations.