2023 Antarctic MERRA-2 Potential Vorticity
Daily progression
The daily progression through the 2023 ozone hole season of the various potential vorticity statistics, comparing 2023 to the climatology of all other years. Clicking a link will bring up, in a new window, a PDF vector plot or a plain-text ASCII data file that is suitable for input into any program.
vortex area
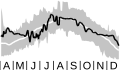
The area of the vortex. (Plot is shown for 1 April–31 December on the 460-K isentropic surface.)
vortex edge potential vorticity
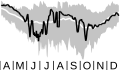
The potential vorticity at the polar vortex edge. (Plot is shown for 1 April–31 December on the 460-K surface.)
minimum potential vorticity
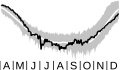
The minimum potential vorticity inside the polar vortex. (Plot is shown for 1 April–31 December on the 460-K surface.)
year
- 1979
- 1980
- 1981
- 1982
- 1983
- 1984
- 1985
- 1986
- 1987
- 1988
- 1989
- 1990
- 1991
- 1992
- 1993
- 1994
- 1995
- 1996
- 1997
- 1998
- 1999
- 2000
- 2001
- 2002
- 2003
- 2004
- 2005
- 2006
- 2007
- 2008
- 2009
- 2010
- 2011
- 2012
- 2013
- 2014
- 2015
- 2016
- 2017
- 2018
- 2019
- 2020
- 2021
- 2022
- 2023
- 2024
- 2025
- 2026
variable
Data description
The Antarctic polar vortex acts as a barrier to the exchange of polar and midlatitude air. The potential vorticity (PV) is a conserved quantity that acts as a tracer for motion on an isentropic surface. Plotting contours of PV on an isentropic surface readily shows the extent of the polar vortex. In the Antarctic winter, the PV is more negative going from midlatitudes to the pole. The spacing of PV contours is very wide in the midlatitudes, very tight at the polar vortex edge, and then widens again inside of the vortex. The edge of the vortex is defined to be where the contours of PV are closest together. The area inside of this edge can be determined as the area of the polar vortex.
A useful quantity in analyzing PV and vortex behavior is the equivalent latitude. Since PV tends to decrease from the equator to the South Pole, we calculate the area under successive PV contours. The areas are rearranged so that they vary from 1 at the equator to 0 at the pole. The transformed contours of PV can be thought of as being symmetrically arranged around the pole and monotonically decreasing from the equator to the pole. The latitudes on this transformed map projection are called equivalent latitudes. Plotting PV vs. equivalent latitude shows an interesting shape: an “S” curve, where the upswing area of the “S” is located at the vortex edge. Finding the maximum in the first derivative of PV with respect to equivalent latitude determines the vortex edge.
Data source
The data are from the Modern-Era Retrospective analysis for Research and Applications, Version 2 ( MERRA-2) assimilation, produced by the Goddard Earth Observing System Data Assimilation System (GEOS DAS). MERRA-2 uses a version of the GEOS model with the Gridpoint Statistical Interpolation (GSI) atmospheric analysis developed jointly with NOAA/NCEP/EMC. Since it takes about two months to incorporate these data into the statistics, we supplement the MERRA-2 assimilation with the GEOS FP assimilation system that provides analyses and forecasts. This assimilation system is also produced by the GEOS DAS. and integrates forefront versions of the GEOS atmospheric general circulation model with advanced data assimilation techniques, using a broad range of satellite observations.