2016/2017 Arctic MERRA-2 Temperature
Temperature daily progression and annual means
The daily progression through 2016/2017 of the various temperature statistics, comparing 2016/2017 to the climatology of all other years. Also, annual plots of statistics for monthly means. Clicking a link will bring up, in a new window, a PDF vector plot or a plain-text ASCII data file that is suitable for input into any program. The annual plots show the range of daily values that go into each year's average with shading. Gray shading and black data points indicate temperatures above the PSC NAT (Type I) temperature. Red shading and data points indicate temperatures below the PSC NAT temperature and above the PSC ice (Type II) temperature. Blue shading and data points indicate temperatures below the PSC ice temperature.
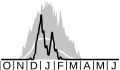
minumum temperature
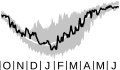
The minimum Arctic temperature is determined for latitudes north of 50°N. (Plot is shown for 1 October–30 June on the 50-hPa surface.)
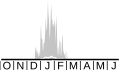
60°–90°N Temperature
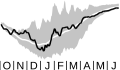
The temperature averaged around the polar cap for latitudes north of 60°N. This is a good measure of the overall temperature in the polar vortex. (Plot is shown for 1 October–30 June on the 50-hPa surface.)
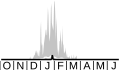
55°–75°N Temperature
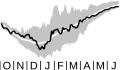
The temperature averaged for 55°N to 75°N. This is a good measure of the temperature in the polar vortex boundary region. (Plot is shown for 1 October–30 June on the 50-hPa surface.)
PSC daily progression and annual means
The daily progression through 2016/2017 of the PSC area and volume statistics, comparing 2016/2017 to the climatology of all other seasons. Also, annual plots of the PSC area and volume. Clicking a link will bring up, in a new window, a PDF vector plot or a plain-text ASCII data file that is suitable for input into any program. The annual plots show the range of daily values that go into each year's average with shading.
PSC NAT area
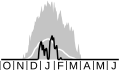
Area of PSCs formed from nitric acid trihydrate (NAT). We assume a fixed profile of nitric acid, with a value of 4.54 ppt on the 460-K potential temperature surface, and a fixed concentration of water at 5.0 ppm. We interpolate temperatures to potential temperature surfaces and then find the area of temperatures less than the condensation temperature for each surface. (Plot is shown for 1 October–30 June on the 460-K surface.)
PSC NAT volume
To calculate the volume, we first calculate areas and then integrate the areas over the range of input levels. Instead of using fixed theta levels, we calculate an average value of theta over each pressure level from 60°N to 90°N. (Plot is shown for 1 October–30 June.)
PSC ice area
Area of PSCs formed from ice. We assume a fixed profile of nitric acid, with a value of 4.54 ppt on the 460-K potential temperature surface, and a fixed concentration of water at 5.0 ppm. We interpolate temperatures to potential temperature surfaces and then find the area of temperatures less than the condensation temperature for each surface. (Plot is shown for 1 October–30 June on the 460-K surface.)
PSC ice volume
To calculate the volume, we first calculate areas and then integrate the areas over the range of input levels. Instead of using fixed theta levels, we calculate an average value of theta over each pressure level from 60°N to 90°N. (Plot is shown for 1 October–30 June.)
year
- 1978/1979
- 1979/1980
- 1980/1981
- 1981/1982
- 1982/1983
- 1983/1984
- 1984/1985
- 1985/1986
- 1986/1987
- 1987/1988
- 1988/1989
- 1989/1990
- 1990/1991
- 1991/1992
- 1992/1993
- 1993/1994
- 1994/1995
- 1995/1996
- 1996/1997
- 1997/1998
- 1998/1999
- 1999/2000
- 2000/2001
- 2001/2002
- 2002/2003
- 2003/2004
- 2004/2005
- 2005/2006
- 2006/2007
- 2007/2008
- 2008/2009
- 2009/2010
- 2010/2011
- 2011/2012
- 2012/2013
- 2013/2014
- 2014/2015
- 2015/2016
- 2016/2017
- 2017/2018
- 2018/2019
- 2019/2020
- 2020/2021
- 2021/2022
- 2022/2023
- 2023/2024
- 2024/2025
- 2025/2026
variable
Data description
Temperatures that are cold enough can form polar stratospheric clouds (PSCs). PSCs are an important component in the destruction of ozone molecules. PSCs can be formed when temperatures fall below a given threshold for each type of PSC. The formation temperature is dependent on concentrations of nitric acid and water vapor, and the potential temperature of the air. PSCs can be formed from sulfate aerosols, nitric acid trihydrate (NAT), or ice. PSC areas in the Arctic are about half of what they are in the Antarctic.
Data source
The data are from the Modern-Era Retrospective analysis for Research and Applications, Version 2 ( MERRA-2) assimilation, produced by the Goddard Earth Observing System Data Assimilation System (GEOS DAS). MERRA-2 uses a version of the GEOS model with the Gridpoint Statistical Interpolation (GSI) atmospheric analysis developed jointly with NOAA/NCEP/EMC. Since it takes about two months to incorporate these data into the statistics, we supplement the MERRA-2 assimilation with the GEOS FP assimilation system that provides analyses and forecasts. This assimilation system is also produced by the GEOS DAS. and integrates forefront versions of the GEOS atmospheric general circulation model with advanced data assimilation techniques, using a broad range of satellite observations.