2016/2017 Arctic MERRA-2 Heat Flux
Temperature daily progression and annual means
The daily progression through the 2016/2017 season of the various heat flux statistics, comparing 2016/2017 to the climatology of all other seasons. Also, annual plots of statistics for monthly means. Clicking a link will bring up, in a new window, a PDF vector plot or a plain-text ASCII data file that is suitable for input into any program. The annual plots show the range of daily values that go into each year's average with shading.
45-day total eddy heat flux
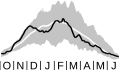
The eddy heat flux averaged between 45°N and 75°N for the 45-day period prior to the date indicated. (Plot is shown for 1 October–30 June on the 100-hPa surface.)
45-day wave 1–3 eddy heat flux
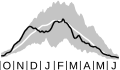
The waves 1–3 eddy heat flux averaged between 45°N and 75°N for the 45-day period prior to the date indicated. The lower wave numbers tend to dominate the total eddy heat flux and generally show a better relationship with temperature. PLot is shown for 1 October–30 June on the 100-hPa surface.)
total eddy heat flux
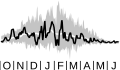
The eddy heat flux averaged between 45°N and 75°N. (Plot is shown for 1 October–30 June on the 100-hPa surface.)
wave 1–3 eddy heat flux
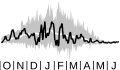
The waves 1–3 eddy heat flux averaged between 45°N and 75°N. The lower wave numbers tend to dominate the total eddy heat flux and generally show a better relationship with temperature. (Plot is shown for 1 October–30 June on the 100-hPa surface.)
year
- 1978/1979
- 1979/1980
- 1980/1981
- 1981/1982
- 1982/1983
- 1983/1984
- 1984/1985
- 1985/1986
- 1986/1987
- 1987/1988
- 1988/1989
- 1989/1990
- 1990/1991
- 1991/1992
- 1992/1993
- 1993/1994
- 1994/1995
- 1995/1996
- 1996/1997
- 1997/1998
- 1998/1999
- 1999/2000
- 2000/2001
- 2001/2002
- 2002/2003
- 2003/2004
- 2004/2005
- 2005/2006
- 2006/2007
- 2007/2008
- 2008/2009
- 2009/2010
- 2010/2011
- 2011/2012
- 2012/2013
- 2013/2014
- 2014/2015
- 2015/2016
- 2016/2017
- 2017/2018
- 2018/2019
- 2019/2020
- 2020/2021
- 2021/2022
- 2022/2023
- 2023/2024
- 2024/2025
- 2025/2026
variable
Data description
Variations of temperature are strongly affected by weather systems in the troposphere. Very large-scale weather systems or waves can move or propagate upward into the stratosphere. The upward propagation of these weather systems warms the polar region. We measure this upward flow of wave energy with the eddy heat flux. The eddy heat flux is the product of north-south (meridional) wind departures and temperature departures from their respective zonal-mean values. There is a strong anticorrelation between stratospheric temperature and the 45-day average of the eddy heat flux lagged prior to the temperature. A more positive value of eddy heat flux indicates that wave systems are moving into the stratosphere and are warming the polar region. Wave events distort the polar vortex and allow for greater mixing inside the vortex. These events can result in major and minor polar warmings.
Data source
The data are from the Modern-Era Retrospective analysis for Research and Applications, Version 2 ( MERRA-2) assimilation, produced by the Goddard Earth Observing System Data Assimilation System (GEOS DAS). MERRA-2 uses a version of the GEOS model with the Gridpoint Statistical Interpolation (GSI) atmospheric analysis developed jointly with NOAA/NCEP/EMC. Since it takes about two months to incorporate these data into the statistics, we supplement the MERRA-2 assimilation with the GEOS FP assimilation system that provides analyses and forecasts. This assimilation system is also produced by the GEOS DAS. and integrates forefront versions of the GEOS atmospheric general circulation model with advanced data assimilation techniques, using a broad range of satellite observations.