1981 Antarctic MERRA-2 Wind
Daily progression and annual means
The daily progression through 1981 of the various wind statistics, comparing 1981 to the climatology of all other years. Also, annual plots of statistics for monthly means. Clicking a link will bring up, in a new window, a PDF vector plot or a plain-text ASCII data file that is suitable for input into any program. The annual plots show the range of daily values that go into each year's average with shading.
60°S zonal wind
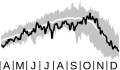
The average east-west (zonal) wind speed for 60°S. This is near the peak of the polar jet maximum. A 45 m s-1wind speed is equal to 100 mph. (Image is shown for 1 April–31 December on the 100-hPa surface.)
45°–75°S zonal wind
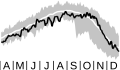
The average east-west (zonal) wind speed for 45°S to 75°S. This is near the peak of the polar jet maximum. A 45 m s-1wind speed is equal to 100 mph. (Image is shown for 1 April–31 December on the 100-hPa surface.)
year
- 1979
- 1980
- 1981
- 1982
- 1983
- 1984
- 1985
- 1986
- 1987
- 1988
- 1989
- 1990
- 1991
- 1992
- 1993
- 1994
- 1995
- 1996
- 1997
- 1998
- 1999
- 2000
- 2001
- 2002
- 2003
- 2004
- 2005
- 2006
- 2007
- 2008
- 2009
- 2010
- 2011
- 2012
- 2013
- 2014
- 2015
- 2016
- 2017
- 2018
- 2019
- 2020
- 2021
- 2022
- 2023
- 2024
- 2025
- 2026
variable
Data description
The Antarctic continent is circled by a strong jet stream in the stratosphere (above 12 km or 39,000 ft). Looking down on the South Pole, this jet stream flows around Antarctica in a clockwise sense. This jet stream isolates air over Antarctica from air in the midlatitudes. The region poleward of this jet stream is called the Antarctic polar vortex. A stronger jet stream flow results in greater isolation of polar air from midlatitude air (less mixing). The air inside the Antarctic polar vortex is also much colder then midlatitude air.
Data source
The data are from the Modern-Era Retrospective analysis for Research and Applications, Version 2 ( MERRA-2) assimilation, produced by the Goddard Earth Observing System Data Assimilation System (GEOS DAS). MERRA-2 uses a version of the GEOS model with the Gridpoint Statistical Interpolation (GSI) atmospheric analysis developed jointly with NOAA/NCEP/EMC. Since it takes about two months to incorporate these data into the statistics, we supplement the MERRA-2 assimilation with the GEOS FP assimilation system that provides analyses and forecasts. This assimilation system is also produced by the GEOS DAS. and integrates forefront versions of the GEOS atmospheric general circulation model with advanced data assimilation techniques, using a broad range of satellite observations.